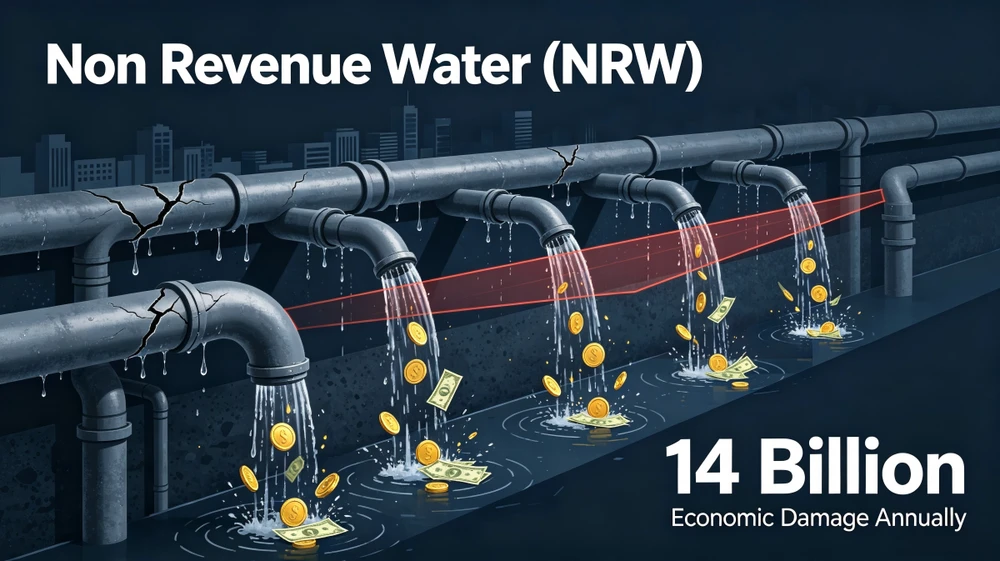
The global water crisis is not just about scarcity—it’s about waste. According to the World Bank, urban water systems lose an average of 35% of their supplied water to non revenue water (NRW), translating to over 1 trillion cubic meters of lost water annually and $14 billion in economic damage. For water-stressed regions like the Middle East, where NRW rates can exceed 50%, this waste isn’t just a financial drain; it’s a threat to public health and environmental stability. As utilities grapple with aging infrastructure, growing demand, and regulatory pressure, addressing NRW has moved from a secondary concern to a core operational priority. This article breaks down authoritative definitions, measurement frameworks, impacts, and proven strategies for NRW reduction, grounded in international standards from the International Water Association (IWA), American Water Works Association (AWWA), and ISO.
Defining NRW: Authoritative Frameworks from the IWA
“Non Revenue Water (NRW) encompasses all water that is produced and enters the distribution system but is not billed to customers. It includes both real losses (water lost through leaks and overflows) and apparent losses (water that is consumed but not billed due to meter inaccuracies, theft, or data errors).” – Established in IWA 2019 Water Losses Manual.
This definition splits NRW into two distinct categories, each with unique drivers and solutions:
Real Losses: Physical Leaks and Overflows
Real losses account for 60-70% of total NRW in most systems, representing water that physically escapes the network before reaching customers. This includes:
- Mainline leaks: Cracks or breaks in primary distribution pipes, often caused by corrosion, soil movement, or pressure surges. In the U.S., the Environmental Protection Agency (EPA) estimates that 240,000 water main breaks occur annually, losing 1.7 trillion gallons of water.
- Distribution pipe leaks: Smaller leaks in secondary pipes that supply neighborhoods, which can go undetected for months due to their size. A 2022 study by the University of Sheffield found that 30% of distribution pipe leaks are not identified by standard monitoring methods.
- Storage tank overflows: Uncontrolled releases from reservoirs or tanks, often caused by faulty level sensors or manual operational errors. In India, overflows from municipal storage tanks contribute to 15% of total NRW in urban areas.
- Customer connection leaks: Leaks in pipes between the main distribution line and the customer’s meter, which are often the responsibility of the property owner but can go unreported for years.
Apparent Losses: Unbilled or Misrecorded Water
Apparent losses make up the remaining 30-40% of NRW, representing water that is used but not properly accounted for. Key contributors include:
- Meter inaccuracies: Aging mechanical meters can have error rates of up to 5%, with under-recording being the most common issue. A 2021 AWWA survey found that 40% of water meters in the U.S. are over 15 years old, leading to $2.3 billion in uncollected revenue annually.
- Illegal water use: Unauthorized connections, meter tampering, and bypasses, which are prevalent in low-income areas and regions with weak regulatory enforcement. In Brazil, illegal connections account for 20% of total NRW in major cities like São Paulo.
- Data errors: Manual recording mistakes, billing system glitches, and unaccounted-for authorized uses (such as firefighting or public cleaning) that are not properly logged.
| Category | Proportion | Definition | Main Types & Details | Relevant Data & Cases |
|---|---|---|---|---|
| Real Losses (Physical Leaks and Overflows) | 60–70% of total NRW | Water physically escaping the pipeline network before delivery to end users | 1. Mainline leaks: Pipe damage from corrosion, soil movement or pressure surges 2. Distribution pipe leaks: Small secondary pipe leaks, hard to detect 3. Storage tank overflows: Caused by faulty sensors or operational errors 4. Customer connection leaks: Leaks on pipes between mains and user meters | 1. US EPA: 240,000 water main breaks yearly, 1.7 trillion gallons lost 2. University of Sheffield (2022): 30% of distribution pipe leaks evade standard monitoring 3. India: Tank overflows cause 15% of urban NRW |
| Apparent Losses (Unbilled or Misrecorded Water) | 30–40% of total NRW | Water consumed but not properly recorded or billed | 1. Meter inaccuracies: Under-recording by ageing mechanical meters 2. Illegal water use: Unauthorized connections and meter tampering 3. Data errors: Manual mistakes, system faults and unlogged authorized water use | 1. AWWA (2021): 40% of US meters are over 15 years old, leading to $2.3 billion annual revenue loss; meter error rate up to 5% 2. Brazil: Illegal connections contribute 20% of NRW in major cities like São Paulo |
How to solve Apparent Losses for Non Revenue Water (NRW)?
Measuring NRW: Standardized Methods for Accuracy
Accurate NRW measurement is the foundation of effective reduction strategies. Without reliable data, utilities cannot set realistic targets, identify problem areas, or track progress. The IWA’s Water Balance Framework is the global gold standard, outlined in its 2019 manual with the following formula:
System Input Volume = Billed Authorized Consumption + Unbilled Authorized Consumption
Unbilled Authorized Consumption = Apparent Losses + Real Losses
(Source: IWA Water Losses Manual, 2019)
This framework requires utilities to track four key components:
- System Input Volume: Total water produced or purchased by the utility, measured at the point of entry into the distribution system.
- Billed Authorized Consumption: Water that is consumed by customers and billed, including residential, commercial, and industrial use.
- Unbilled Authorized Consumption: Water used for legitimate purposes but not billed, such as firefighting, public parks, or utility maintenance.
- Losses: The sum of apparent and real losses, calculated as the difference between system input and authorized consumption.
Beyond the water balance, utilities use targeted measurement techniques to pinpoint losses:
Minimum Night Flow (MNF) Monitoring
Recommended in AWWA’s M36:2021 Water Loss Control guide, MNF monitoring involves measuring water flow during periods of minimal customer demand (typically 2-6 a.m.). By subtracting known night-time use (such as street cleaning or hotel operations) from the total flow, utilities can estimate the volume of water lost to leaks. A MNF rate above 10% of average daily flow indicates significant leak issues.
Smart Metering Systems
Advanced smart meters provide real-time data on water use, allowing utilities to detect anomalies like sudden spikes (indicating leaks) or consistent under-recording (indicating meter errors). Singapore’s Public Utilities Board (PUB) replaced 95% of its mechanical meters with smart meters between 2016 and 2020, reducing meter-related apparent losses by 85% and cutting NRW from 6% to 4%.
Acoustic Leak Detection
Acoustic sensors, mounted on pipes or ground surfaces, pick up the sound of water escaping through cracks. Modern systems use machine learning to distinguish leak sounds from background noise, improving detection accuracy by 30% compared to traditional methods. Dubai’s Electricity and Water Authority (DEWA) deployed drone-mounted acoustic sensors in 2022, identifying 122 hidden leaks in its main distribution network that had gone undetected for years.
Key Technologies for Water Loss Mitigation
| Technology | Core Focus | Key Benchmark |
|---|---|---|
| Minimum Night Flow (MNF) Monitoring | Leakage estimation via low-demand period flow measurement | AWWA M36:2021 recommended; >10% of average daily flow indicates significant leaks |
| Smart Metering Systems | Real-time water use anomaly detection | Singapore PUB case: 85% reduction in meter-related losses, NRW cut from 6% to 4% |
| Acoustic Leak Detection | Crack leak sound identification via sensors + ML | 30% higher accuracy than traditional methods; DEWA case: 122 hidden leaks identified |
The Multifaceted Impact of NRW
Economic Impact
For utilities, NRW directly reduces revenue while increasing operational costs. The World Bank estimates that every 1% reduction in NRW can save a mid-sized utility (serving 500,000 customers) over $50 million annually in avoided water production and treatment costs. In South Africa, the City of Johannesburg reduced its NRW rate from 40% to 28% between 2018 and 2023, generating an additional $120 million in annual revenue.
Environmental Impact
Every liter of lost water represents wasted energy and resources. The EPA calculates that treating and pumping 1 cubic meter of water requires 0.5 to 1.2 kilowatt-hours of electricity. Globally, NRW-related energy use generates 280 million tons of CO₂ annually—equivalent to the emissions of 60 million cars. In arid regions like Australia, lost water also means reduced flow in rivers and aquifers, harming aquatic ecosystems and threatening biodiversity.
Operational and Social Impact
High NRW rates can lead to unstable water pressure, increasing the risk of pipe breaks and water contamination. Utilities with NRW rates above 30% are 2.3 times more likely to experience boil-water advisories, according to a 2023 study by the Water Research Foundation. For customers, NRW can lead to higher water bills as utilities pass on the cost of lost water, and reduced service reliability during peak demand periods.
Proven Strategies for NRW Reduction: Technical and Operational Solutions
Reducing NRW requires a combination of technical upgrades, operational improvements, and cultural change. Below are evidence-based strategies aligned with international standards:
Pressure Management
Excessive water pressure is a leading cause of pipe leaks and breaks. The IWA recommends maintaining distribution pressure between 20 and 50 meters of head to minimize leak risk. Pressure reducing valves (PRVs) and smart pressure control systems allow utilities to adjust pressure based on demand, reducing leaks by 20-30%. London’s Thames Water implemented a zone-based pressure management program between 2015 and 2020, installing 1,200 PRVs and reducing its NRW rate from 28% to 21%.
Active Leakage Control
Active leakage control involves proactively detecting and repairing leaks before they escalate. This includes:
- Noise loggers: Battery-powered sensors installed on pipes that transmit leak data to a central system. A 2022 IWA study found that utilities using noise loggers reduce real losses by 15-25% within two years.
- Ground-penetrating radar (GPR): Used to locate underground pipe leaks without excavation, reducing repair time by 40% compared to traditional methods.
- Leak repair prioritization: Using data from smart meters and flow sensors to prioritize repairs based on leak size, location, and potential impact.
Infrastructure Rehabilitation
Aging pipes are a major contributor to real losses. The EPA estimates that 240,000 water mains break annually in the U.S., with the average pipe age exceeding 45 years. Utilities can use multi-criteria analysis to prioritize pipe replacement, considering factors like pipe age, material, leak history, and traffic volume. Copenhagen’s HOFOR utility replaced 10% of its cast-iron pipes with ductile iron between 2018 and 2023, reducing real losses by 18%.
Meter Management
Regular meter calibration and replacement are critical to reducing apparent losses. ISO 4064:2019 specifies that water meters should be calibrated every 3-5 years, depending on usage. The City of Toronto replaced 200,000 mechanical meters with smart meters between 2019 and 2022, reducing meter error rates from 4.2% to 0.3% and increasing annual revenue by $18 million.
Institutional and Cultural Change
NRW reduction requires buy-in from all levels of the utility organization. Key steps include:
- Performance-based contracts: Outsourcing leakage control to third-party vendors with incentives tied to NRW reduction targets. In Colombia, the city of Medellín used performance-based contracts to reduce NRW from 45% to 28% between 2016 and 2021.
- Employee training: Certifying staff through the IWA NRW Management Training Program, which covers water balance analysis, leak detection, and pressure management.
- Stakeholder engagement: Working with customers to report leaks and reduce illegal water use. In Kenya, Nairobi Water launched a mobile app for leak reporting, leading to a 25% increase in leak repairs within six months.
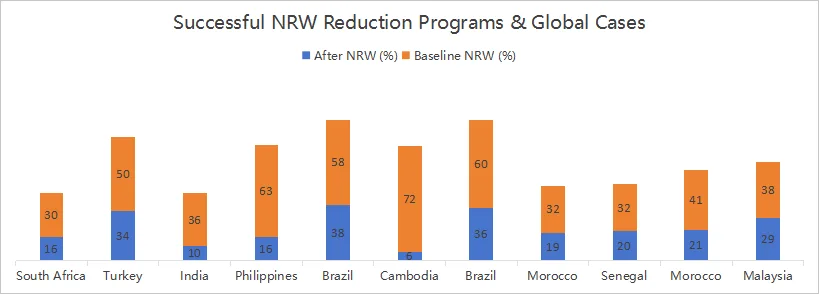
Successful NRW Reduction Programs & Global Cases
| Location | Land | Baseline Year | Baseline NRW (%) | Target Year | After NRW (%) | Implementing Utility | Utility Type | NRW Reduction (Percentage Points) |
|---|---|---|---|---|---|---|---|---|
| Dolphin Coast (iLembe) | South Africa | 1999 | 30 | 2003 | 16 | Siza Water Company | Private | 14 |
| Istanbul | Turkey | 1994 | >50 | 2000 | 34 | ISKI | Public | >16 |
| Jamshedpur | India | 2005 | 36 | 2009 | 10 | Jamshedpur Utilities and Services Company | Private | 26 |
| East Manila | Philippines | 1997 | 63 | 2009 | 16 | Manila Water | Private | 47 |
| Paranaguá | Brazil | 2000 | 58 | 2006 | 38 | Unnamed Private Utility | Private | 20 |
| Phnom Penh | Cambodia | 1993 | 72 | 2008 | 6 | Phnom Penh Water Supply Authority (PPWSA) | Public | 66 |
| Rio de Janeiro State | Brazil | 2000 | 60 | 2006 | 36 | Unnamed Private Utility | Private | 24 |
| Rabat | Morocco | 2002 | 32 | 2008 | 19 | REDAL | Private | 13 |
| National Cities | Senegal | 1996 | 32 | 2006 | 20 | Senegalaise des Eaux | Private | 12 |
| Tangiers | Morocco | 2002 | 41 | 2008 | 21 | Amendis | Private | 20 |
| 8 Districts, Johor State | Malaysia | 2004 | 38 | 2011 | 29 | Ranhill Utilities | Private | 9 |
Data source by the World Bank Group
Global Standards for NRW Management
Several international standards provide guidelines for NRW assessment and control, ensuring consistency across regions and utilities:
ISO 24510:2019 Water Services — Guidelines for the Assessment and Control of Water Losses
This standard outlines a systematic approach to NRW management, including:
“Water service providers shall establish a water balance as the basis for assessing water losses, set measurable targets for reducing losses, and implement a continuous improvement program to achieve these targets.”
(Source: ISO 24510:2019, Clause 4.2)
ISO 24510 also specifies key performance indicators (KPIs) for NRW, including the Infrastructure Leakage Index (ILI), which compares actual real losses to unavoidable real losses.
AWWA M36:2021 Water Loss Control
This guide provides practical, step-by-step instructions for NRW reduction, covering everything from data collection to leak repair. It emphasizes the importance of regular water balance audits and recommends that utilities conduct full audits every 1-3 years.
IWA NRW Performance Indicators
The IWA’s set of performance indicators allows utilities to benchmark their NRW performance against global peers. Key indicators include:
- NRW Rate: The percentage of system input volume lost to NRW.
- Real Loss Rate: The percentage of system input volume lost to real leaks and overflows.
- Infrastructure Leakage Index (ILI): Calculated as Current Annual Real Losses (CARL) divided by Unavoidable Annual Real Losses (UARL). An ILI above 2 indicates significant leak issues.
Building a Long-Term NRW Management Strategy
Reducing NRW is not a one-time project—it’s a continuous process that requires ongoing investment, data analysis, and collaboration. Utilities that prioritize NRW reduction see significant returns: improved financial stability, reduced environmental impact, and enhanced customer satisfaction.
To succeed, utilities should align with global standards, invest in smart technology, prioritize infrastructure rehabilitation, and engage employees and customers in the process. As the global water crisis intensifies, NRW reduction is no longer optional—it’s essential for ensuring the sustainability of water systems worldwide. By leveraging authoritative frameworks, proven strategies, and modern technology, utilities can unlock hidden value, conserve resources, and build resilient water systems for future generations.
How to solve Apparent Losses for Non Revenue Water (NRW)?
1. Mitigation for Meter Inaccuracies
Three root causes contribute to apparent losses of non-revenue water (NRW), namely meter inaccuracies, illegal water use and data errors. Corresponding targeted technical solutions are proposed to eliminate these apparent losses respectively.
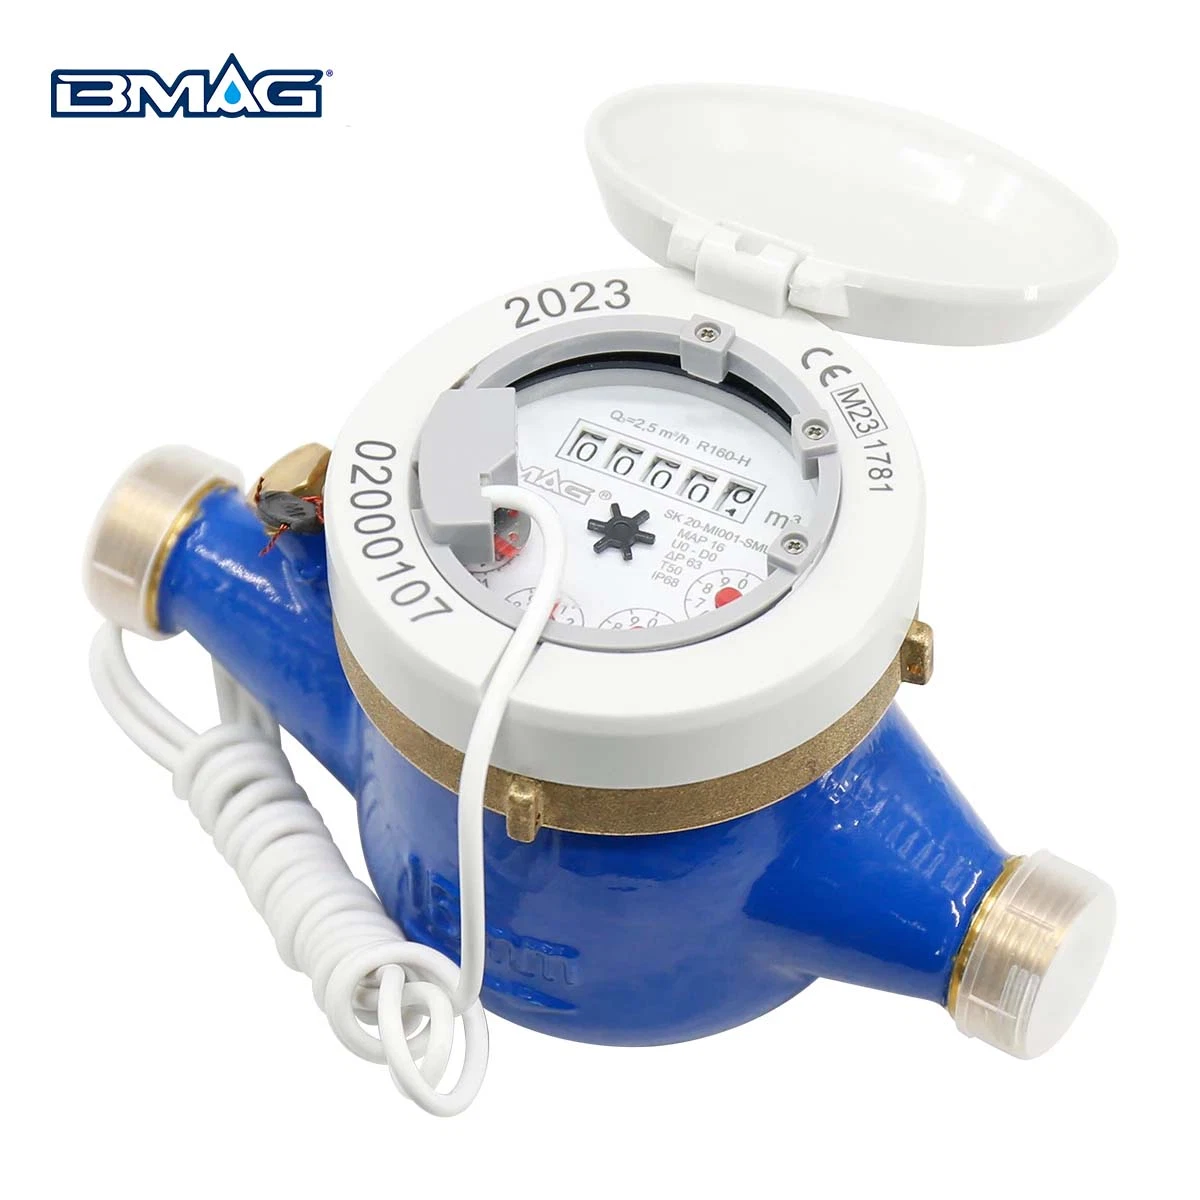
According to the international standard ISO 4064, a permissible flow measurement error of ±5% is allowed for qualified water meters. Minor measurement errors are inevitable for all water meters during long-term operation. Nevertheless, water utilities can effectively cut meter-related NRW by purchasing high-precision water meters manufactured by qualified premium suppliers, such as BMAG Meter. Water meters produced by BMAG adopt mature manufacturing processes and strict quality control systems, with measurement accuracy far exceeding the upper limit specified by ISO 4064 industry standards. Meanwhile, such high-grade meters feature a longer service life than conventional products, which can substantially reduce apparent water losses triggered by cumulative measurement deviations over time.
4.2.3 Accuracy class 2 water meters
The MPE for the upper flow rate zone (Q₂≤ Q≤ Q₄) is ±2% , for temperatures from 0,1°C to 30°C ,and ±3% for temperatures greater than 30°C .
The MPE for the lower flow rate zone (Q₁≤ Q< Q₂) is ±5% regardless of the temperature range.
– ISO 4064-1_2024_Water meters for cold potable water and hot water Part 1 Metrological and technical requirements
2. Mitigation for Illegal Water Use
Common illegal water theft behaviours include four typical approaches: magnetic interference to block meter counting, reverse installation of water meters, intentional damage to meter dial pointers, and stealth low-flow water theft. To tackle these malicious acts, water utilities can deploy upgraded anti-theft water meters equipped with toughened glass panels, built-in anti-magnetic interference modules and reverse installation adaptation functions. This type of intelligent anti-theft meter can effectively prevent most mainstream illegal water tapping activities and curb corresponding apparent losses.
Reverse installation of water meters solution – Leveraging Bi-Directional Water Meters for Advanced Water Anti-Theft Protection
Stealth low-flow water theft solution – High-precision water meters: R200 multi-jet water meters, R400 volumetric water meters, and R800 ultrasonic water meters.
3. Mitigation for Data Errors
The vast majority of data errors in water supply management originate from manual meter reading mistakes. To solve this problem fundamentally, traditional mechanical meters should be upgraded to smart water meters integrated with remote data transmission modules, including LoRa, M-Bus and NB-IoT systems. Fully automatic remote data collection replaces manual on-site reading, eliminating human-operated data errors entirely.
Economic Benefit Evaluation of NRW Renovation Projects
Essentially, non-revenue water management is an economic issue that requires clear cost-benefit analysis for all renovation upgrades. For any practical water network renovation project, the upgrade investment is reasonable and worthy of implementation if the total one-off renovation cost is lower than the accumulated economic losses caused by NRW within five years. In this case, targeted technical upgrades to reduce apparent losses will bring long-term economic returns to water utilities.